
Physics Simulation Review – Projectile Motion
By Scott Holloway
http://www3.interscience.wiley.com:8100/legacy/college/halliday/0471320005/simulations6e/index.htm
One of the difficulties for students in physics is drawing relationships between graphs, equations and actual phenomena happening in real time. This simulation of projectile motion does a good job of comparing the graphs involved with a projectile and the actual motion and velocity vector during the flight.
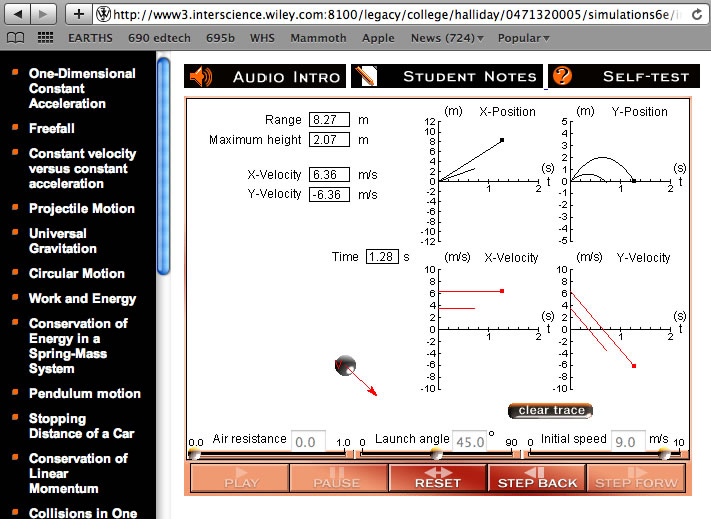
One of the main advantages to this simulation is being able to see the X and Y motion separately. This reinforces the concept that the X and Y influences are independent of one another. You can also see multiple flights plotted on one graph. This allows students to compare the effect of manipulating a given variable like angle of initial speed.
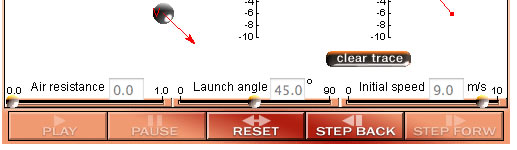
This simulation allows for manipulation of three variables: air resistance, launch angle and initial speed. This allows students to conduct authentic experiments and make predictions based on observations.
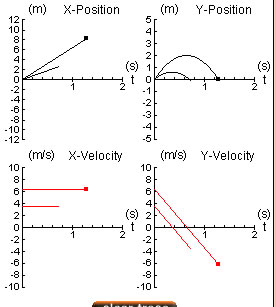
The graphs clearly show relationships between the motion of the projectile and the given quantity being graphed. A student can notice for instance that the speed in the X direction is constant, while the speed in the Y direction changes at a constant rate throughout the flight. Also, the step feature allows the student to look at a given part of the path, like the to top of the flight, easily.
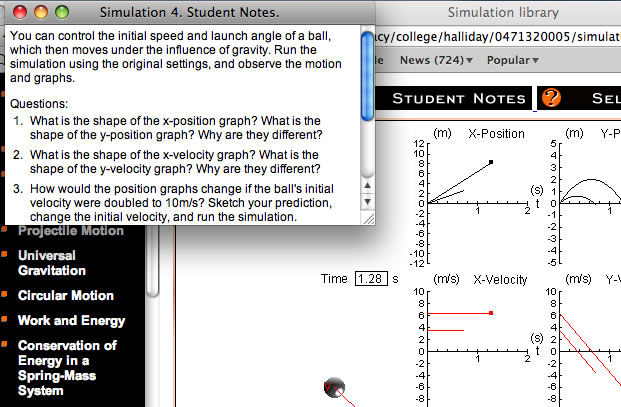
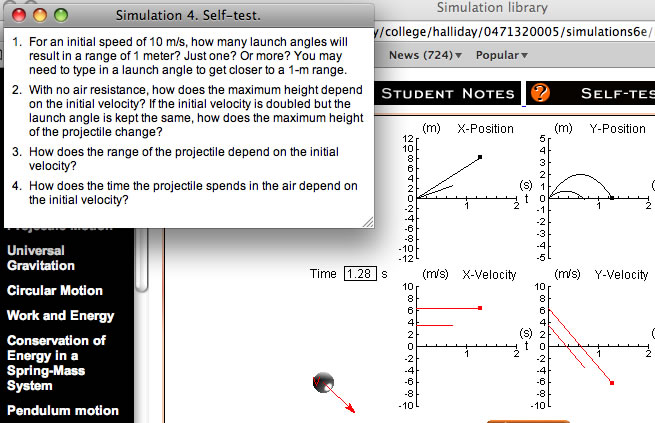
This simulation also includes notes for students. The notes section quickly reviews a concept related to the phenomena being shown. It may also include some reflective questions for the student to consider before, during and after observing the simulation.
After completing the simulated lab, the student can also check to see if they have learned the given concept by answering questions in the self test section.
Overall, I find this simulation very useful for students. They can conduct an very good simulated experiment from home with results that are free from error. Because the graphs are already drawn for them they can focus on the relationship between what the graph shows and what is actually happening. I find that when students draw their own graphs they spend so much time creating the graph that they do not reflect for very long on the meaning of what they drew. This simulation allows students to focus on the connection between the phenomena and the mathematical relationship. This is usually the key concept in a physics course.